
HHI Monitor · September 2026
Canada's export concentration sets another record low as U.S. exports ease in September
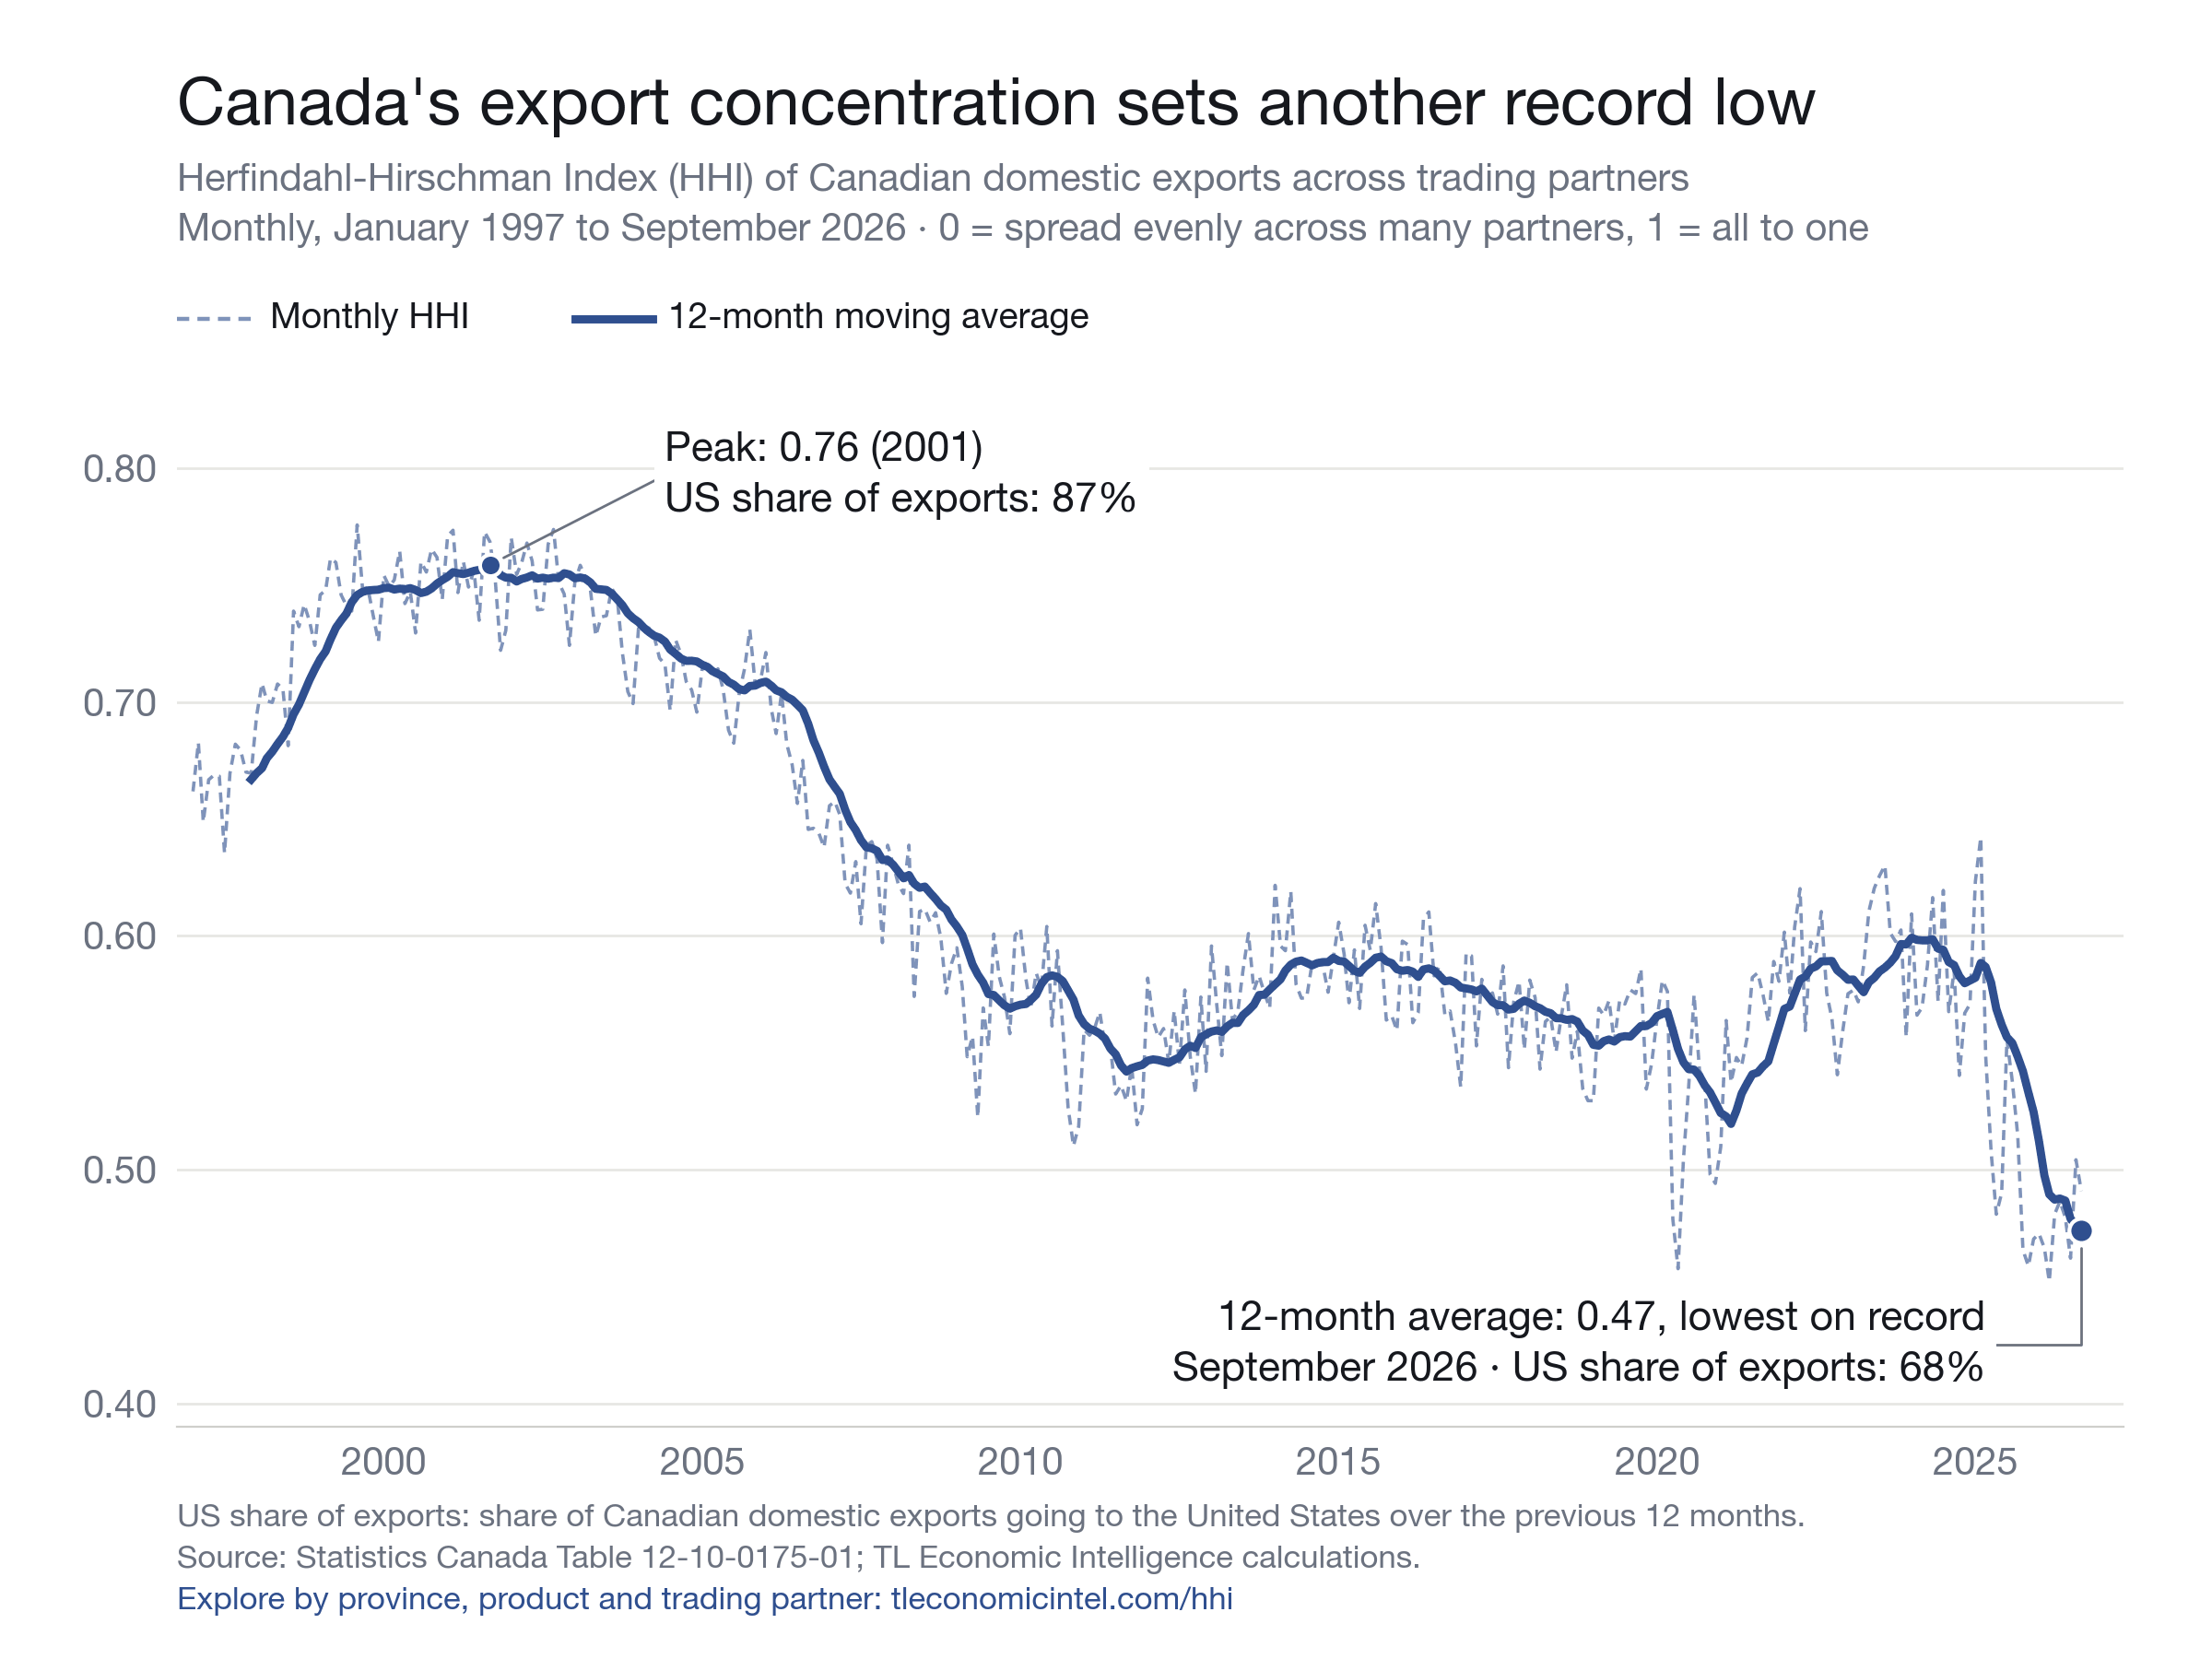
The 12-month moving average of the HHI fell to a new record low of 0.47 in September. Exports to the U.S. gave back part of August's jump, while exports to other markets grew even as shipments to the United Kingdom fell.
The 12-month moving average of the Herfindahl-Hirschman Index (HHI) of Canada’s exports fell to a new record low of 0.47 in September 2026, from 0.48 in August. The HHI measures how concentrated exports are across trading partners, from 0 (spread evenly across many partners) to 1 (all exports to one). The monthly HHI eased to 0.49 from 0.50 in August (revised down from 0.51). A year earlier, the monthly HHI was 0.51 and the 12-month moving average was 0.55.
U.S. exports give back part of August’s jump
Exports to the U.S. fell $1.2 billion in September, to $47.2 billion. That’s a bit over 40% of the $2.8 billion rise in August. Motor vehicles and parts didn’t drive the drop: exports to the U.S. in that sector rose slightly. Energy products led it instead, down $0.8 billion. As a result, the U.S. share of monthly exports fell to 69.2% from 70.1%.
At the same time, exports to all other markets rose $0.4 billion, to $21.0 billion. This happened even though shipments to the United Kingdom fell $0.9 billion. Exports to China rose $0.5 billion, and exports to India and South Korea each rose $0.3 billion. Over the past 12 months, 67.8% of Canada’s domestic exports went to the U.S., down from 73.6% a year earlier and 87.0% at the September 2001 peak.
The year so far
From January to September 2026, exports to the U.S. rose 3.4%, from $392.3 billion to $405.8 billion. Exports to all other markets rose 33.6%, from $143.0 billion to $191.1 billion. The U.S. share of year-to-date exports fell to 68.0% from 73.3%.
The United Kingdom still accounts for 54% of the $48.1 billion increase in non-U.S. exports. Shipments there rose $25.8 billion, to $55.3 billion. Metal and non-metallic mineral products make up 93.1% of that U.K. increase, and Ontario ships 93.2% of it. China is the second-largest gainer, up $9.4 billion (40.2%) to $32.9 billion.
A small step beyond one route
The HHI excluding the U.S. measures how concentrated exports are among Canada’s other markets. Its monthly reading fell to 0.13 in September from 0.14 in August, as the U.K. share shrank and China, India and South Korea grew. But its 12-month moving average is still at a record high of 0.15, up from 0.11 a year earlier. So one month of broader growth doesn’t yet change the trend.
Ontario’s 12-month moving average of 0.47 is also a record low. The U.S. share of its year-to-date exports fell from 74.0% to 64.8%. New Brunswick is still the most concentrated province: 91.0% of its exports went to the U.S. so far this year, and its 12-month moving average is 0.84.
What to watch
Watch whether the monthly HHI excluding the U.S. keeps falling in October. If it does while the headline moving average holds near its record low, diversification is spreading beyond the U.K. route. If U.K. shipments rebound and it rises again, the headline gains still rest on a single market. Also watch whether U.S. exports keep easing or settle back near their July level. The next HHI Monitor covers the October data.
Explore the data: the national trend since 1997, exports excluding the United States, Ontario and New Brunswick. The full dataset is available to download.
Source: Statistics Canada Table 12-10-0175-01; TL Economic Intelligence calculations.